In short: From a folder of 300 invoices, Claude builds a presentation-ready spend dashboard in one prompt. Via PaperOffice MCP it pulls every invoice, aggregates by month and vendor, and produces an artifact you can show the board.
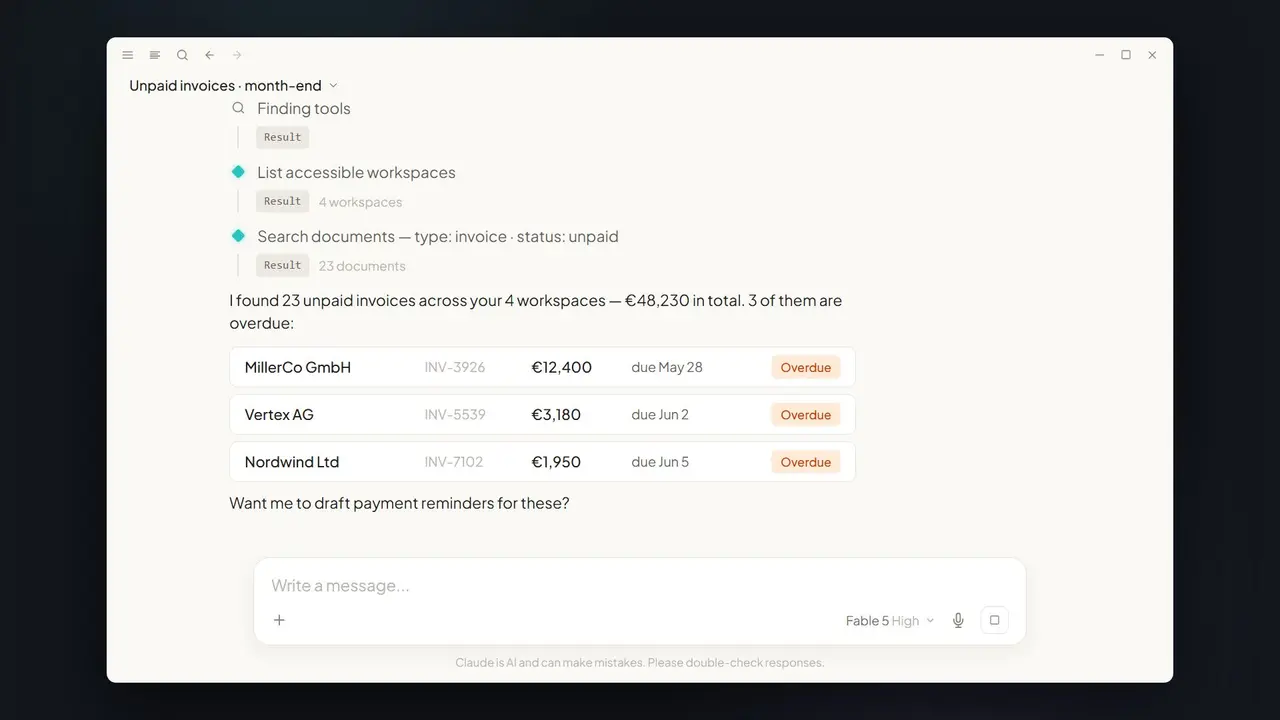
The board wants a spend overview by Monday
Friday afternoon, a folder with 300 invoices, and on Monday the board expects an analysis. Classically that means a weekend in Excel: retyping amounts, building pivot tables. With Claude and MCP, the manual work disappears.
How the one-prompt dashboard works
- Request: describe the dashboard you want in one sentence.
- Pull data: Claude fetches all relevant invoices via
po_documents_search(batch export). - Aggregate:
po_analytics_financial_summary_getandpo_analytics_trends_getcondense by month and vendor. - Visualize: Claude generates a live dashboard artifact — with charts, ready to present.
The exact prompt
With small tweaks, the same data yields more analyses:
- "Show the top 10 vendors by annual spend."
- "Compare this quarter's spend with the previous quarter."
- "Flag months where spend was above average."
- "Build an overview by cost center instead of by vendor."
One prompt, one artifact
Claude returns not a raw list but a finished visualization — spend per month, top vendors, trends. Because the numbers come from real MCP hits, the result is reliable rather than invented.
Which MCP tools work behind the scenes
| Tool | Job |
|---|---|
po_documents_search | Find invoices and batch-export them |
po_analytics_financial_summary_get | Totals by month and vendor |
po_analytics_trends_get | Trends and series for the charts |
Classic vs. Claude + MCP
| Weekend in Excel | With Claude + PaperOffice MCP |
|---|---|
| Retype amounts manually | Automatic batch export |
| Static table | Interactive dashboard artifact |
| Hours of work | One prompt |
Prerequisites
- A PaperOffice account with the workspace that holds the invoices.
- A Bearer token with read and analytics rights.
- A client with artifact support (e.g. Claude Desktop) for the interactive visualization.
Limits & practical tips
For totals to be correct, amounts and vendors must be captured cleanly — faulty OCR values distort the picture. Narrow by period, cost center, or vendor when needed to get meaningful charts. Ask Claude to state its assumptions (e.g. currency conversion) so the board can interpret the numbers. The dashboard does not replace audited accounting, but it is excellent for fast management overviews and trend discussions.
What's inside the artifact
The result is not a static screenshot but an interactive artifact: a bar chart of spend per month, a pie chart of shares by vendor, a top-vendor list, and metrics such as total spend and the monthly average. You can switch periods or highlight individual vendors — with no recalculation. Because the numbers come from real MCP hits with a pofid, every value traces back to the original invoice.
From dashboard to decision
The dashboard becomes truly valuable as recurring board reporting. Save the prompt as a template and each month produces a comparable analysis — ideal for spotting trends and raising budget variances early. Ask Claude to comment on outliers ("Which vendor rose most versus the previous quarter?") and the plain overview turns into a basis for discussion. Together with month-end invoices, the dashboard forms the visual bracket around your invoice data.
More than just invoices
The same mechanism works beyond invoices. Because Claude reaches every authorized document via MCP, you can analyze purchase orders, expenses, or contracts just as easily — for example "spend by cost center" or "contract volume by term." The granularity is up to you too: from a coarse annual overview for the board to a detailed monthly view for the department. Because the dashboard is an interactive artifact, you can adjust assumptions and instantly generate a new variant without re-collecting data. A one-off analysis becomes a flexible analytics tool that grows with your questions.
Security
The dashboard only uses data your token authorizes. Sources stay traceable via pofid.
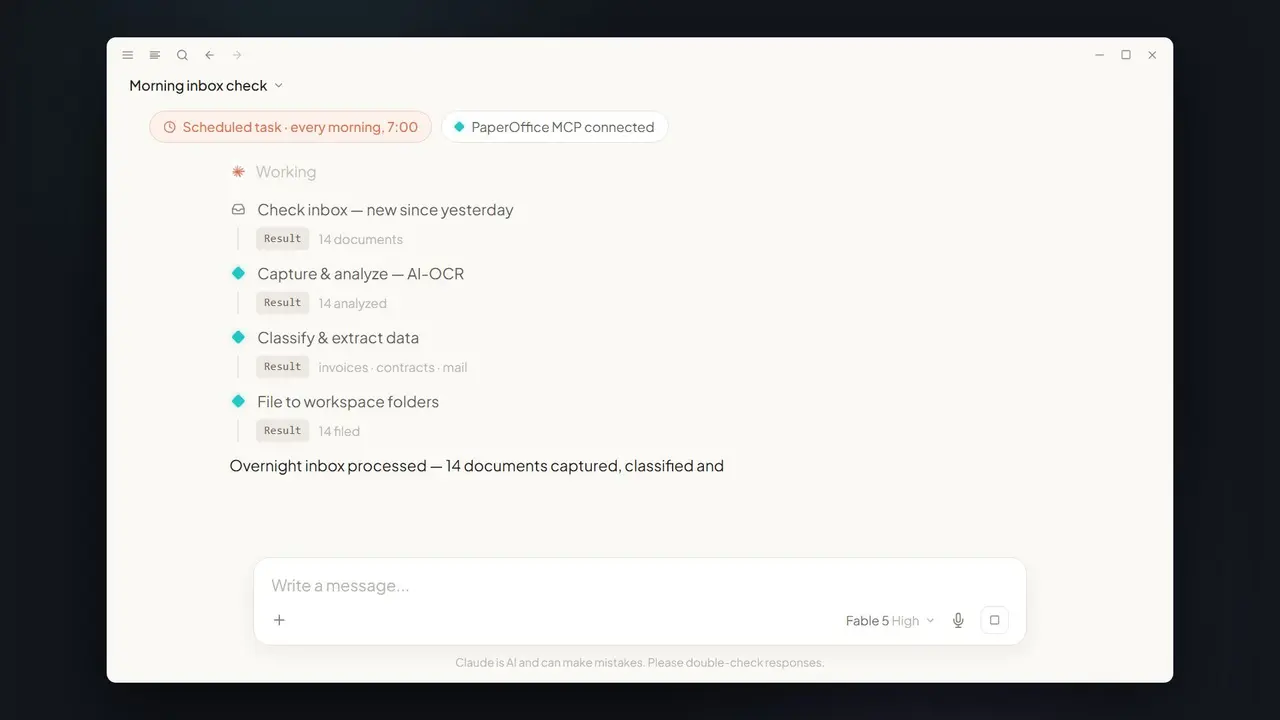
Part of the series: Claude Fable 5 × MCP DMS — the hub article. Related: month-end invoices.