Make support measurable.
Success visible.
Understand your support like never before. Real-time dashboards, AI-powered insights and automatic reports for data-driven decisions.
Trusted by leading companies worldwide
SUPER TRUST
The world’s exclusive sole DMS partner for QNAP and ASUSTOR.
Dedicated landing pages, direct integration, data stays on your NAS.
QNAP
Sole official DMS partner for QNAP NAS — documents stay on your device, AI runs through PaperOffice.
MoreASUSTOR
Sole official DMS partner for ASUSTOR NAS — BYOS, on-premises and full control over where data lives.
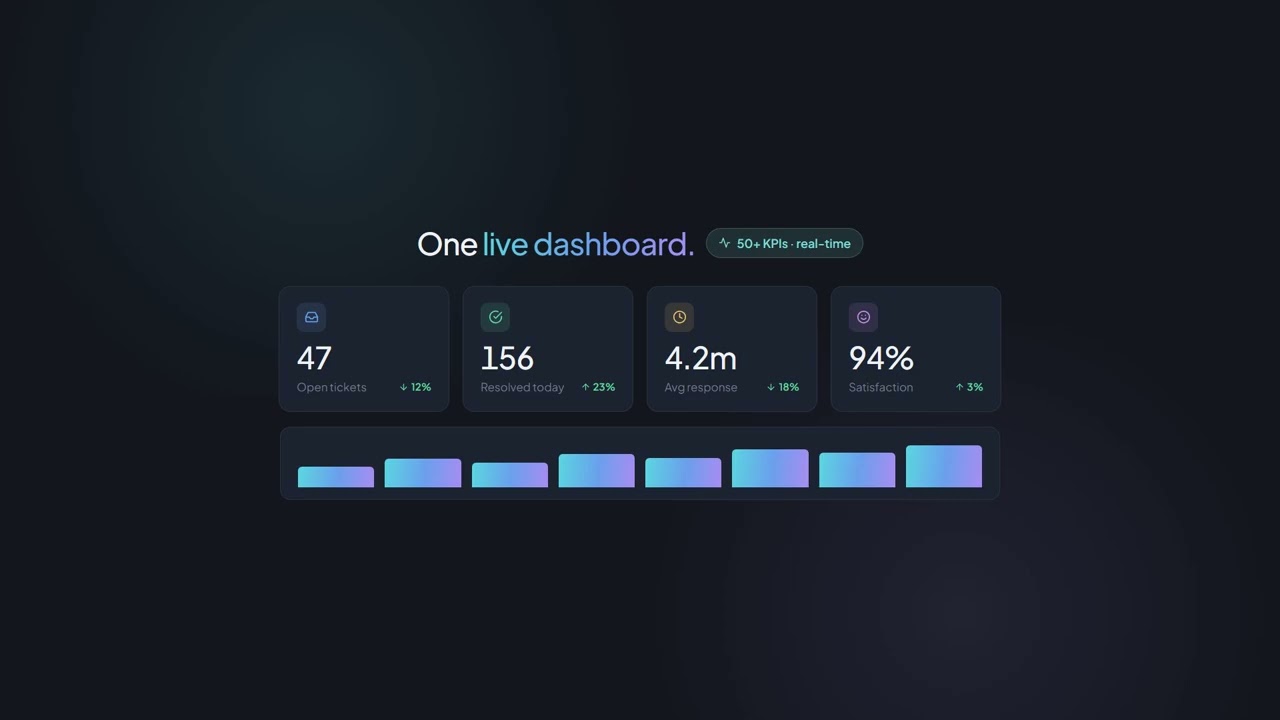
MoreLive Dashboard
All important metrics at a glance.
Support Analytics in action
See how PaperOffice Support Analytics works in practice — in this video.
Ticket Analytics
Detailed insights into your ticket volume.
Ticket Volume
Daily, weekly and monthly trends
Top Categories
Most common requests by topic
Resolution Time
First Response Time, Resolution Time, SLA compliance
Channels
Distribution: Chat, Email, Phone, Portal
Tickets by Status
Agent Performance
Performance metrics for your support team.
Top Performers
AI-Powered Insights
Automatic analysis through artificial intelligence.
Auto-Response Rate
Share of automatically answered inquiries
Deflection Rate
Inquiries resolved via self-service
Sentiment Analysis
Mood of customer inquiries
Volume Forecast
Expected ticket volume tomorrow
Trending Topics
Automatic Reports
Regular reports without manual effort.
Daily Report
Summary of all activities
Weekly Report
Performance overview & trends
Monthly Report
Detailed analysis & KPIs
Custom Reports
Individually configurable
The Difference
Without Analytics
- No overview of support performance
- Decisions based on gut feeling
- Problems detected late
- No possibility for optimization
- Manual report creation time-consuming
With Support Analytics
- Real-time dashboards with all KPIs
- Data-driven decisions
- Proactive problem detection with AI
- Continuous optimization possible
- Automatic reports via email
Ready for data-driven support?
Start now with Support Analytics and make better decisions.